Moneyway
An all-in-one money management platform for SMEs. User research to define pain points and shape the next phase.
Overview
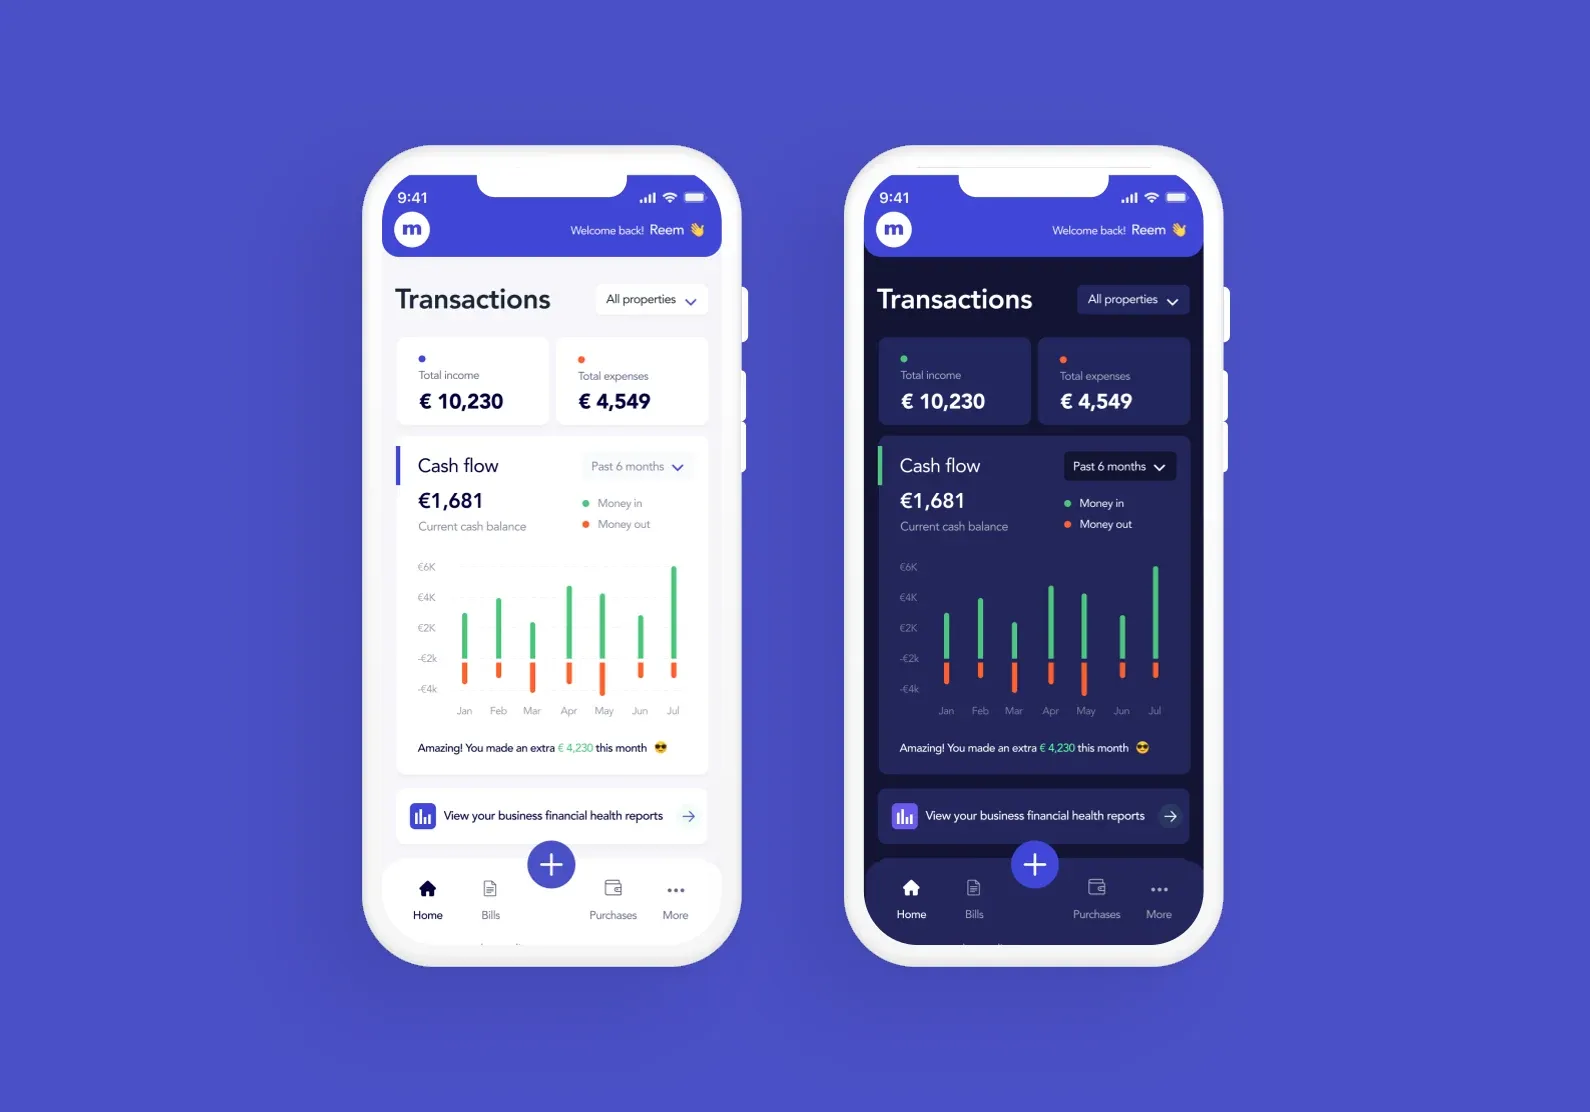
Moneyway is an all-in-one financial management platform for SMEs, designed to make life easier for companies and their accountants. It serves as a single source for a business’s financial data: owners use it to run their business and keep operations running smoothly, from purchasing to revenue management. As SMEs mostly use separate accountancy firms, Moneyway also lets those firms manage their clients’ financial data.
The UX process
The objectives
Gain insight through in-depth interviews around:
- Our users’ needs and expectations.
- The problems our users face when using the app.
- Our suggestions to enhance the experience.
Methodology
- User interviews
- Affinity diagram
- Journey mapping
- Task flows
- Low-fidelity wireframing
- High-fidelity wireframing
- Prototyping & usability testing
- The user interface
Before the user interview
The goal was to understand our users and how Moneyway helps them grow their businesses.
Context. An interview was conducted with one of our users: the owner of a design agency with two offices, in London and Liverpool, employing two teams of 20 people across development, design, project management, HR and sales.
- Define the user. To understand their personality, motivations and goals.
- Define the motivations. How they worked before Moneyway, and which features made them decide to use it.
- What aspects of Moneyway do our users care about most, and why? Which features are beneficial, and how to enhance the experience.
- What aspects of Moneyway cause pain, and why? To uncover what users don’t like, and what might make them leave or switch provider.
The user interview
I don’t know where my money goes.
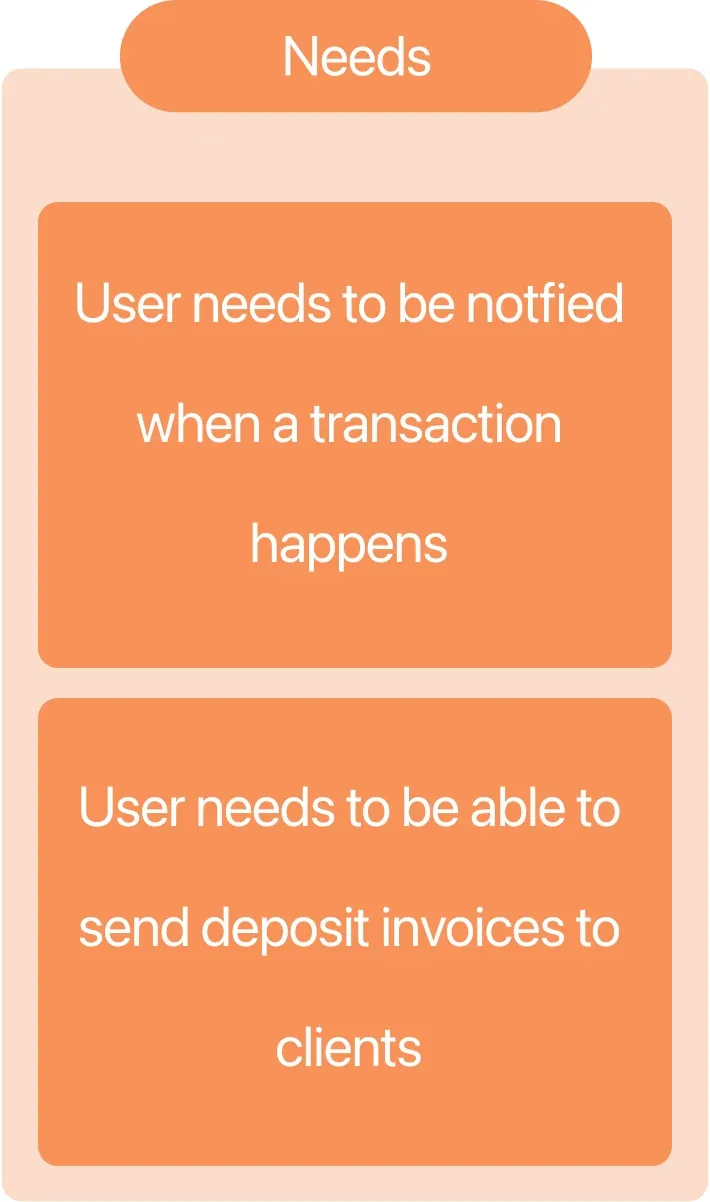
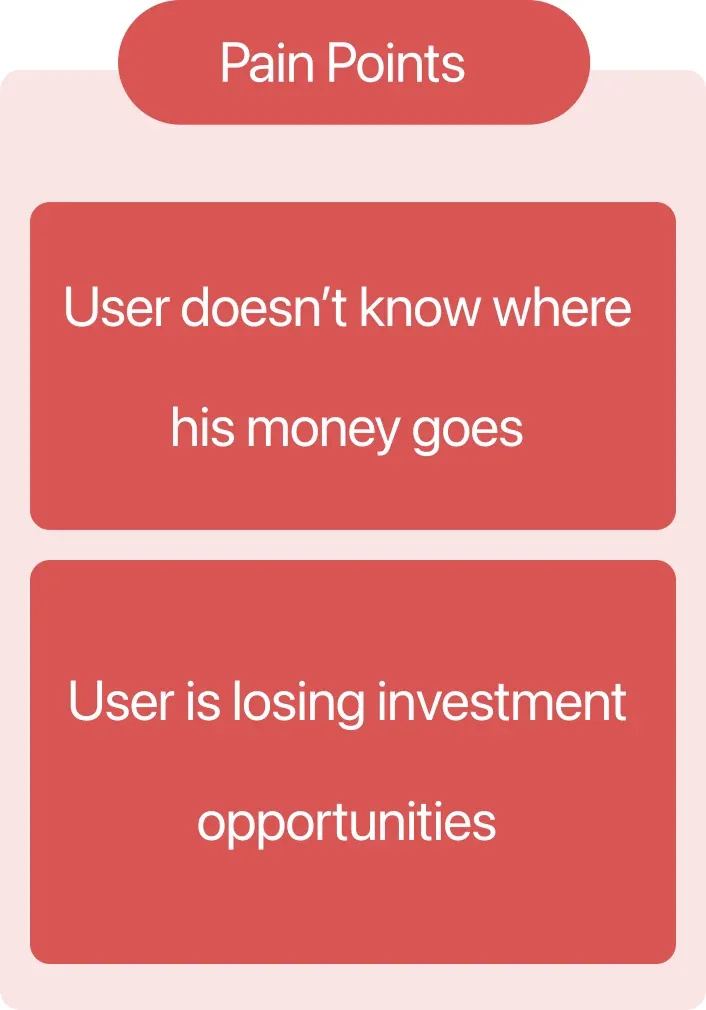
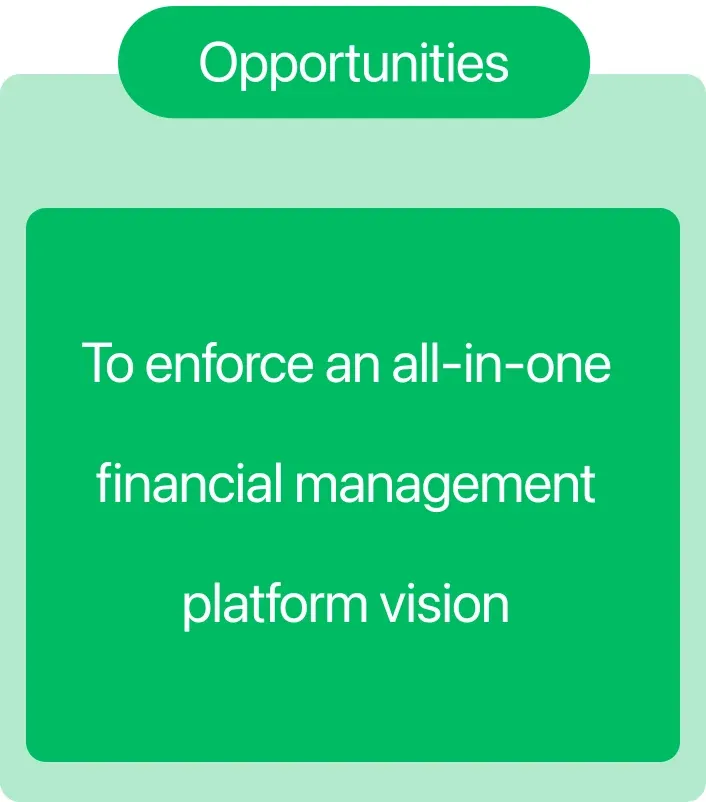
Key takeaways were collected from the interview, then turned into an affinity map to define pain points and areas of improvement.
I didn’t have any information to show in regard to my financial health. This was a struggle.
Current customer journey
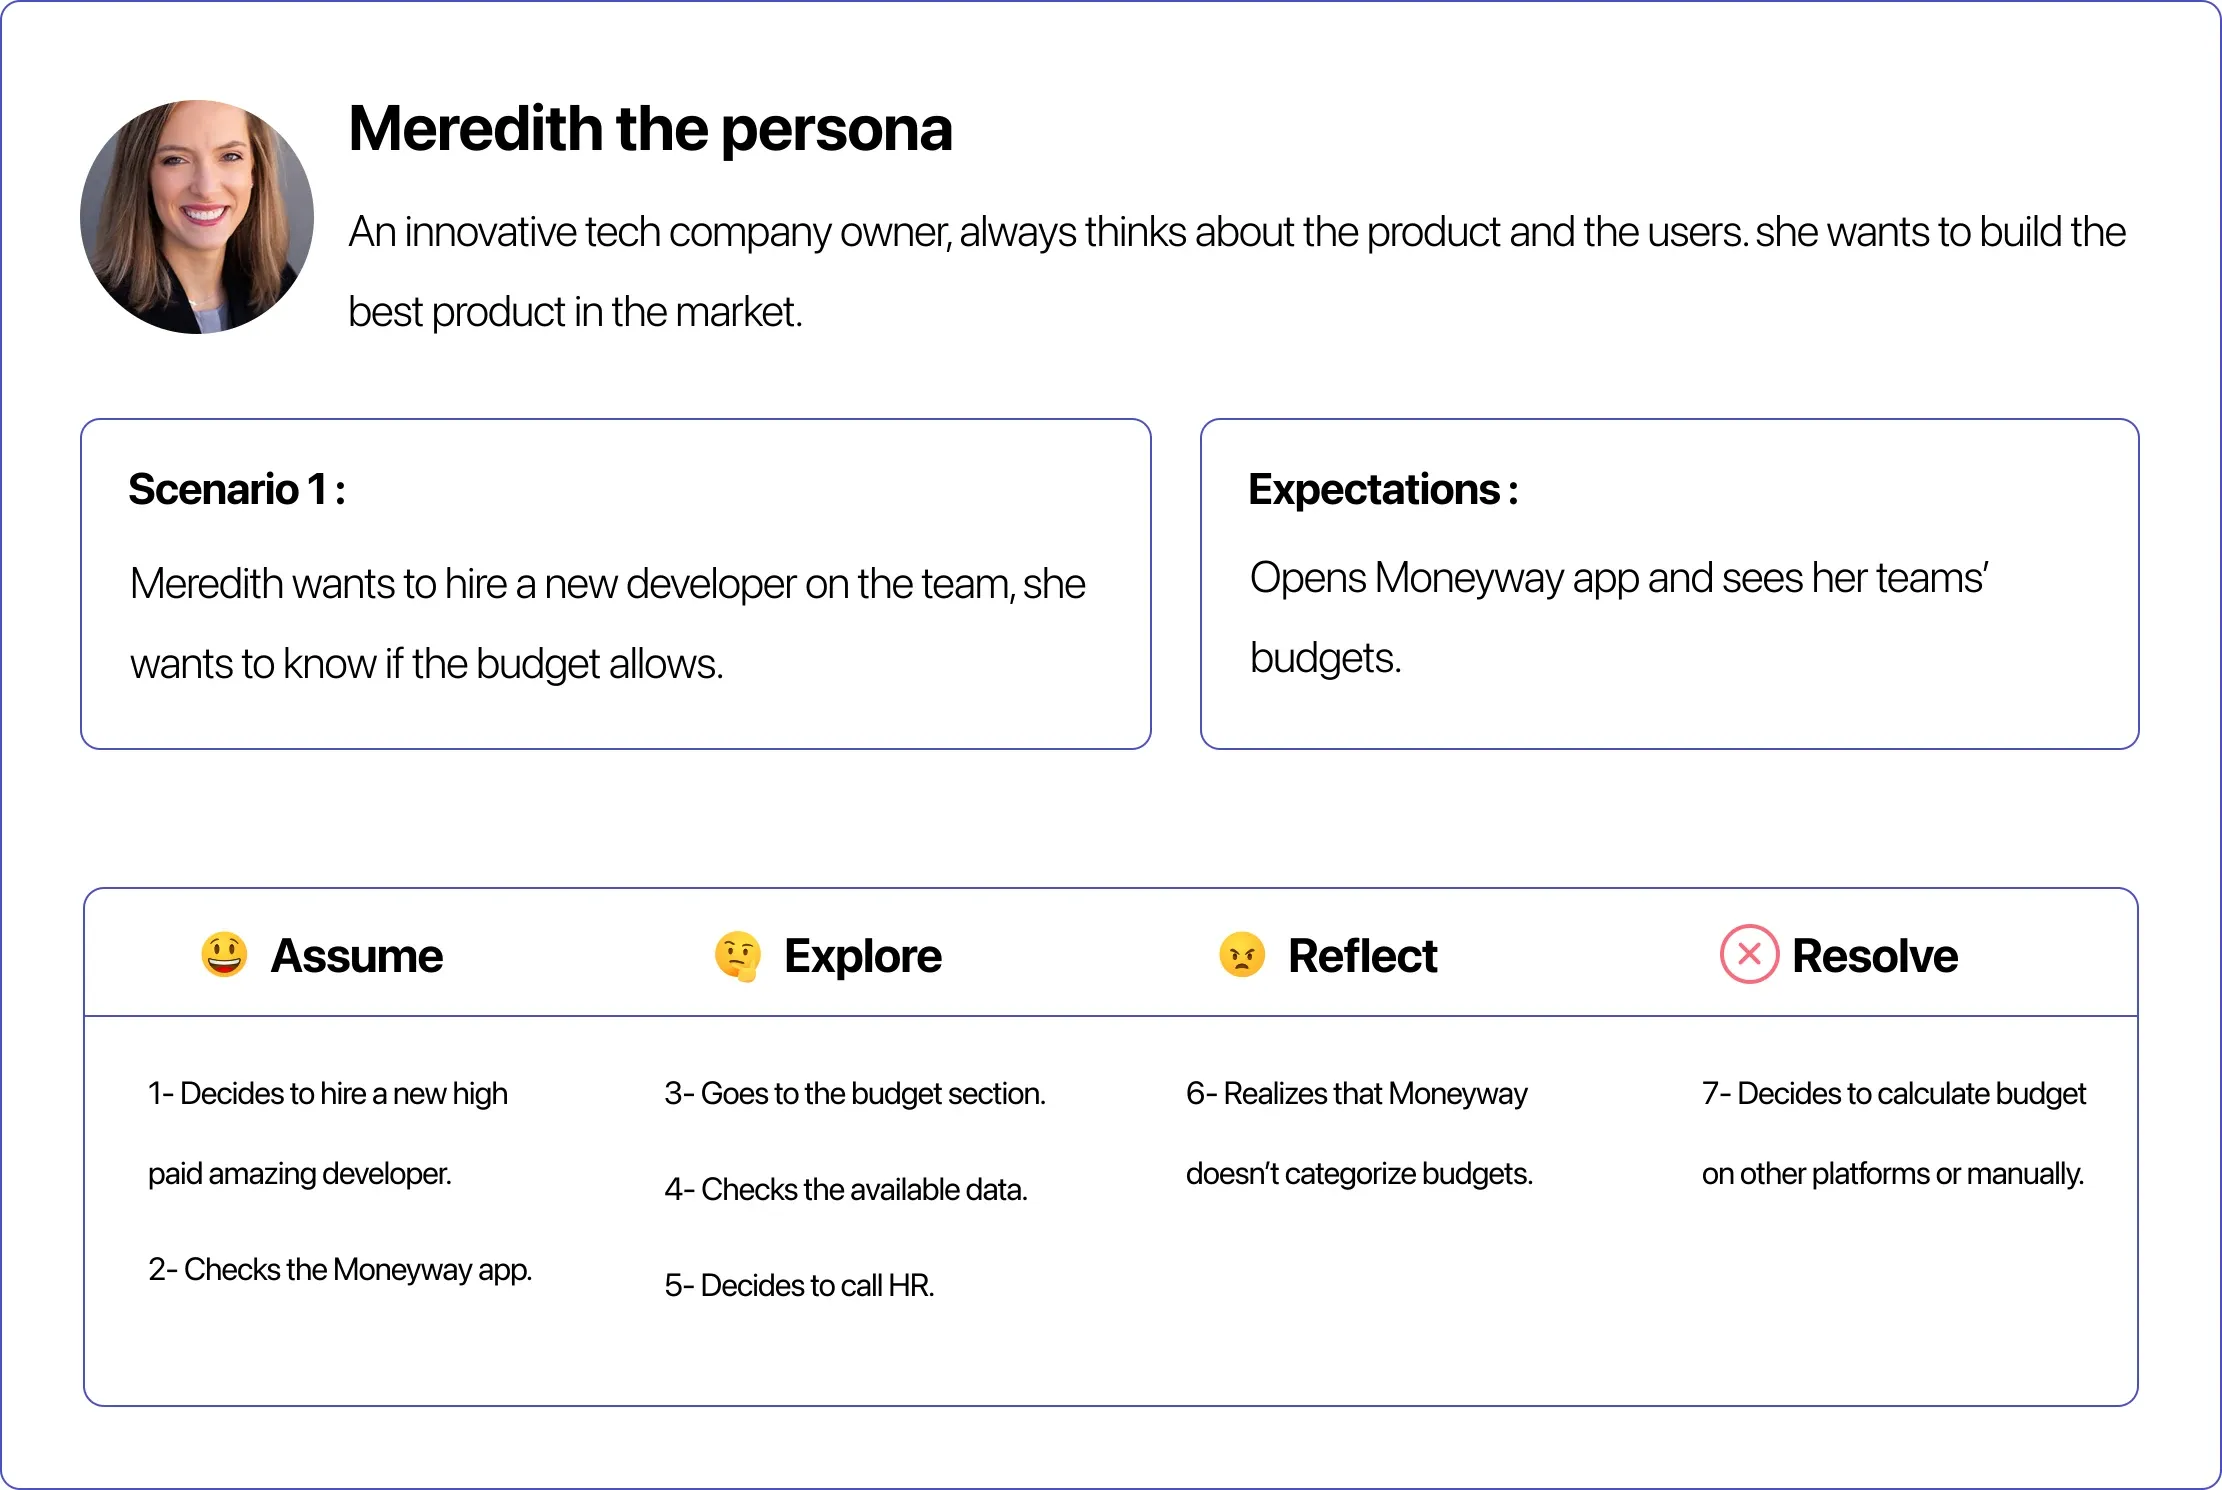
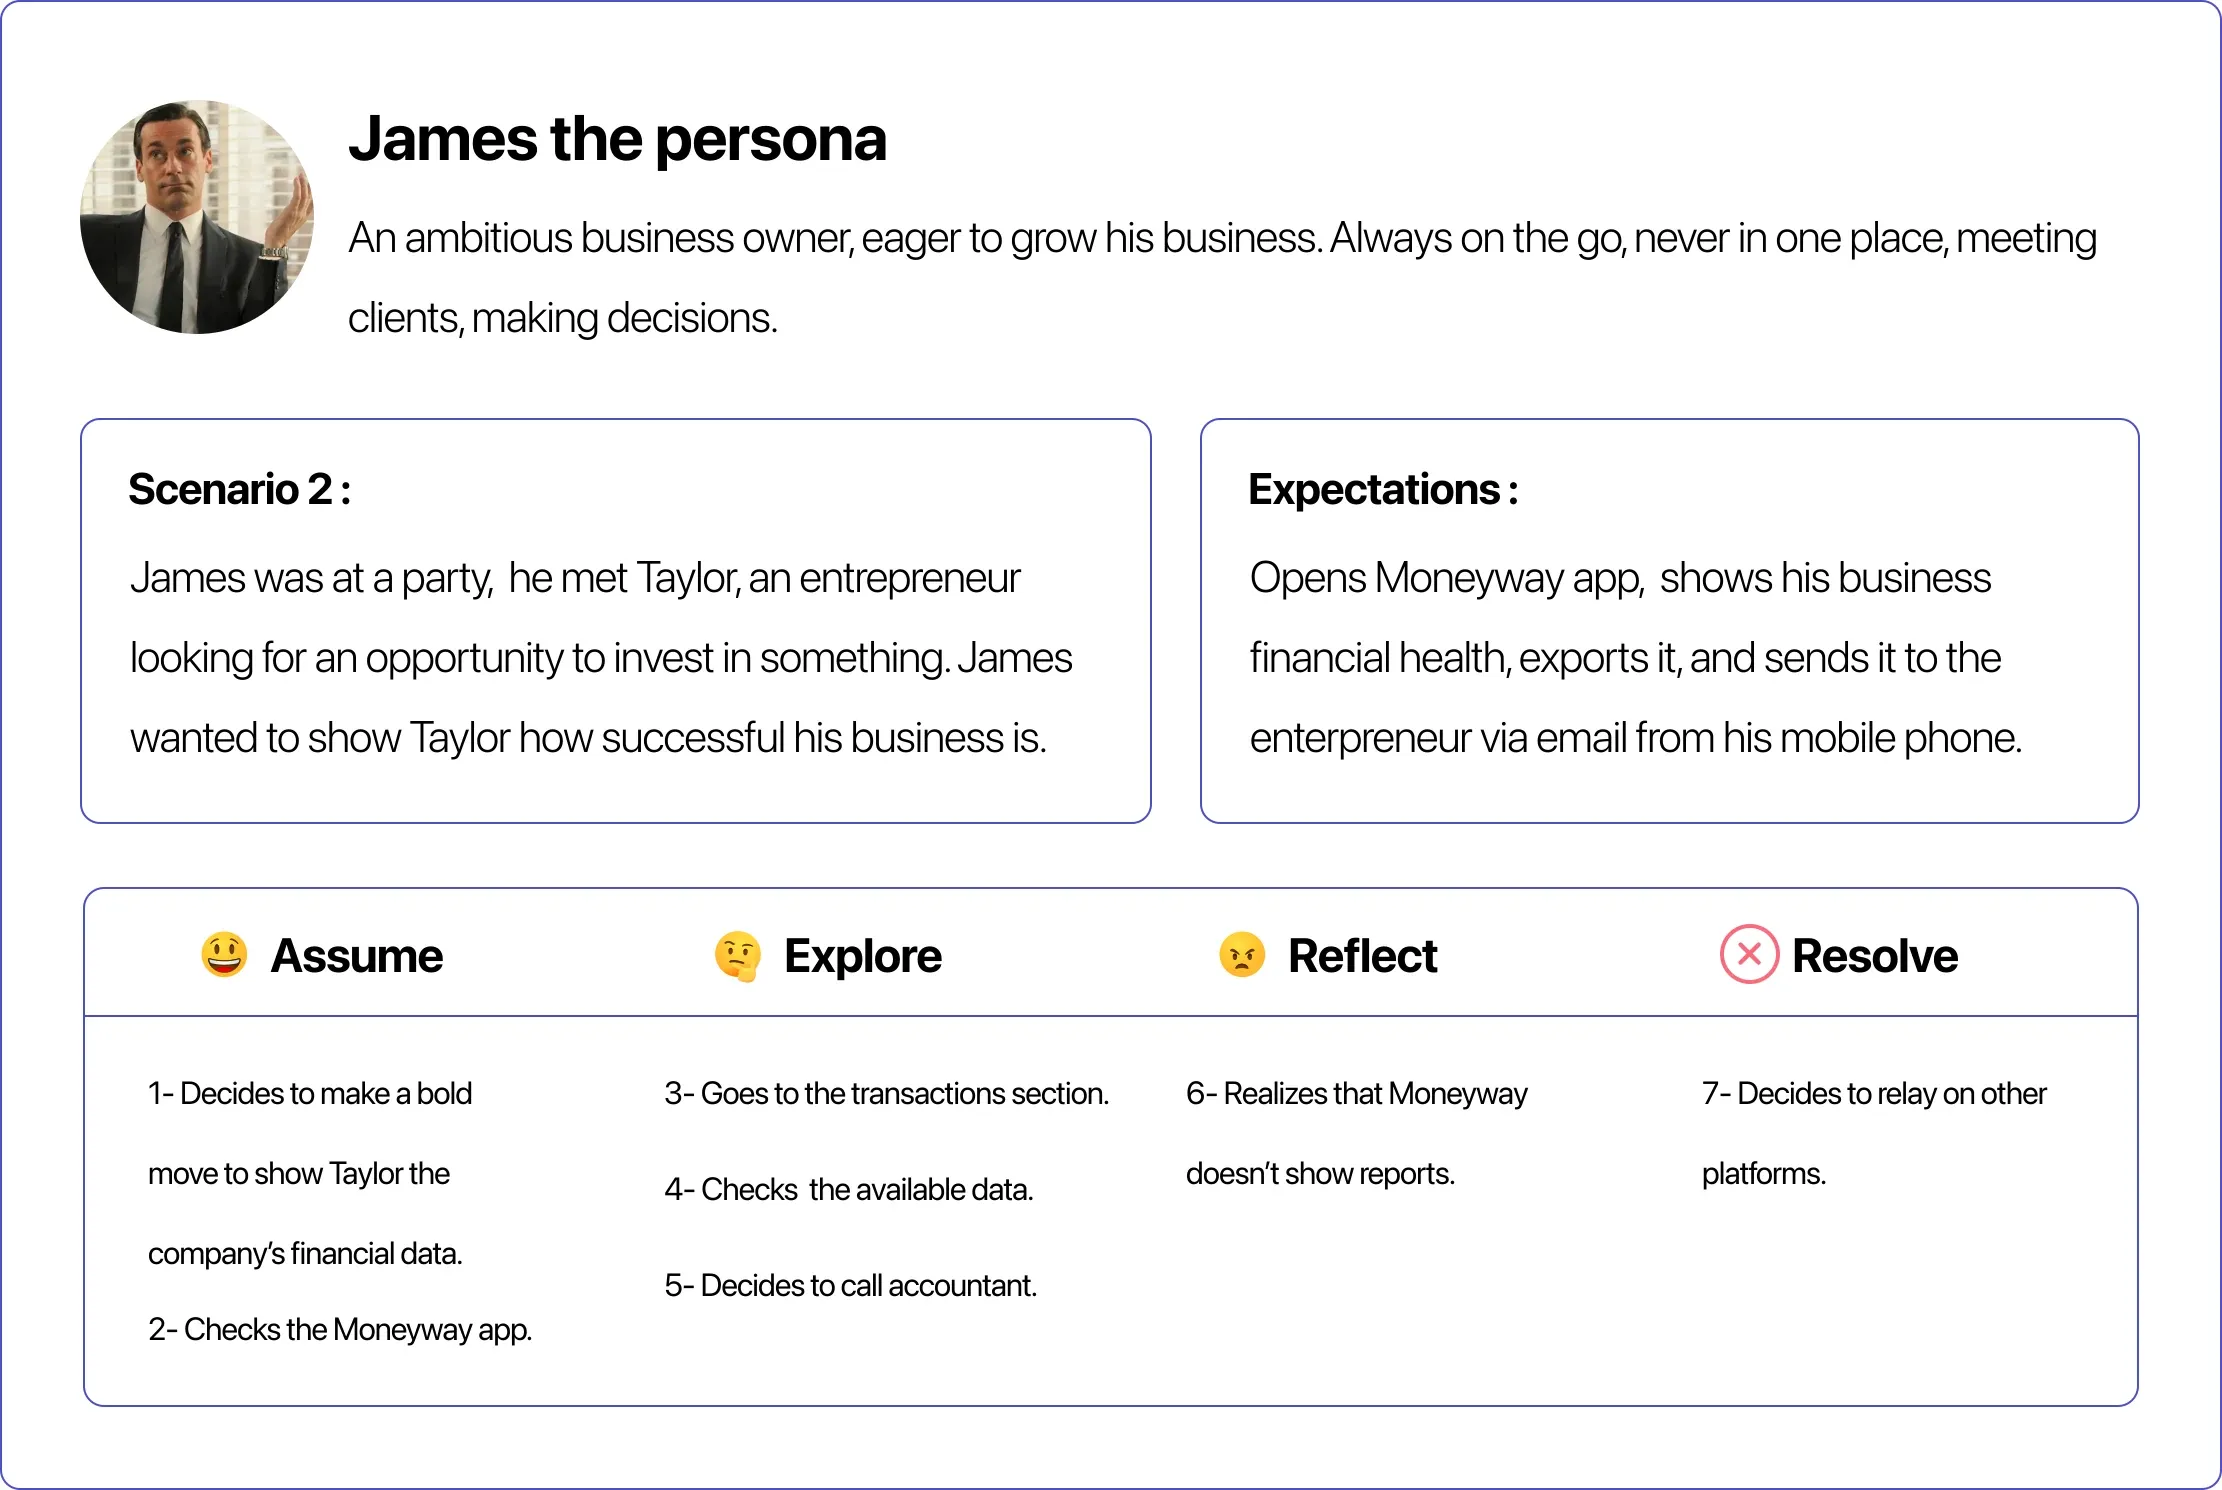
Actions & priorities
Based on the research, I developed an action plan for the next phase. Major pain points needed to be resolved to avoid losing users to other platforms. Losing money, an investment opportunity or a high-calibre employee can affect an SME badly.
Pain points to address
- Moneyway doesn’t help users manage their budget.
- Moneyway doesn’t help users analyse their business information.
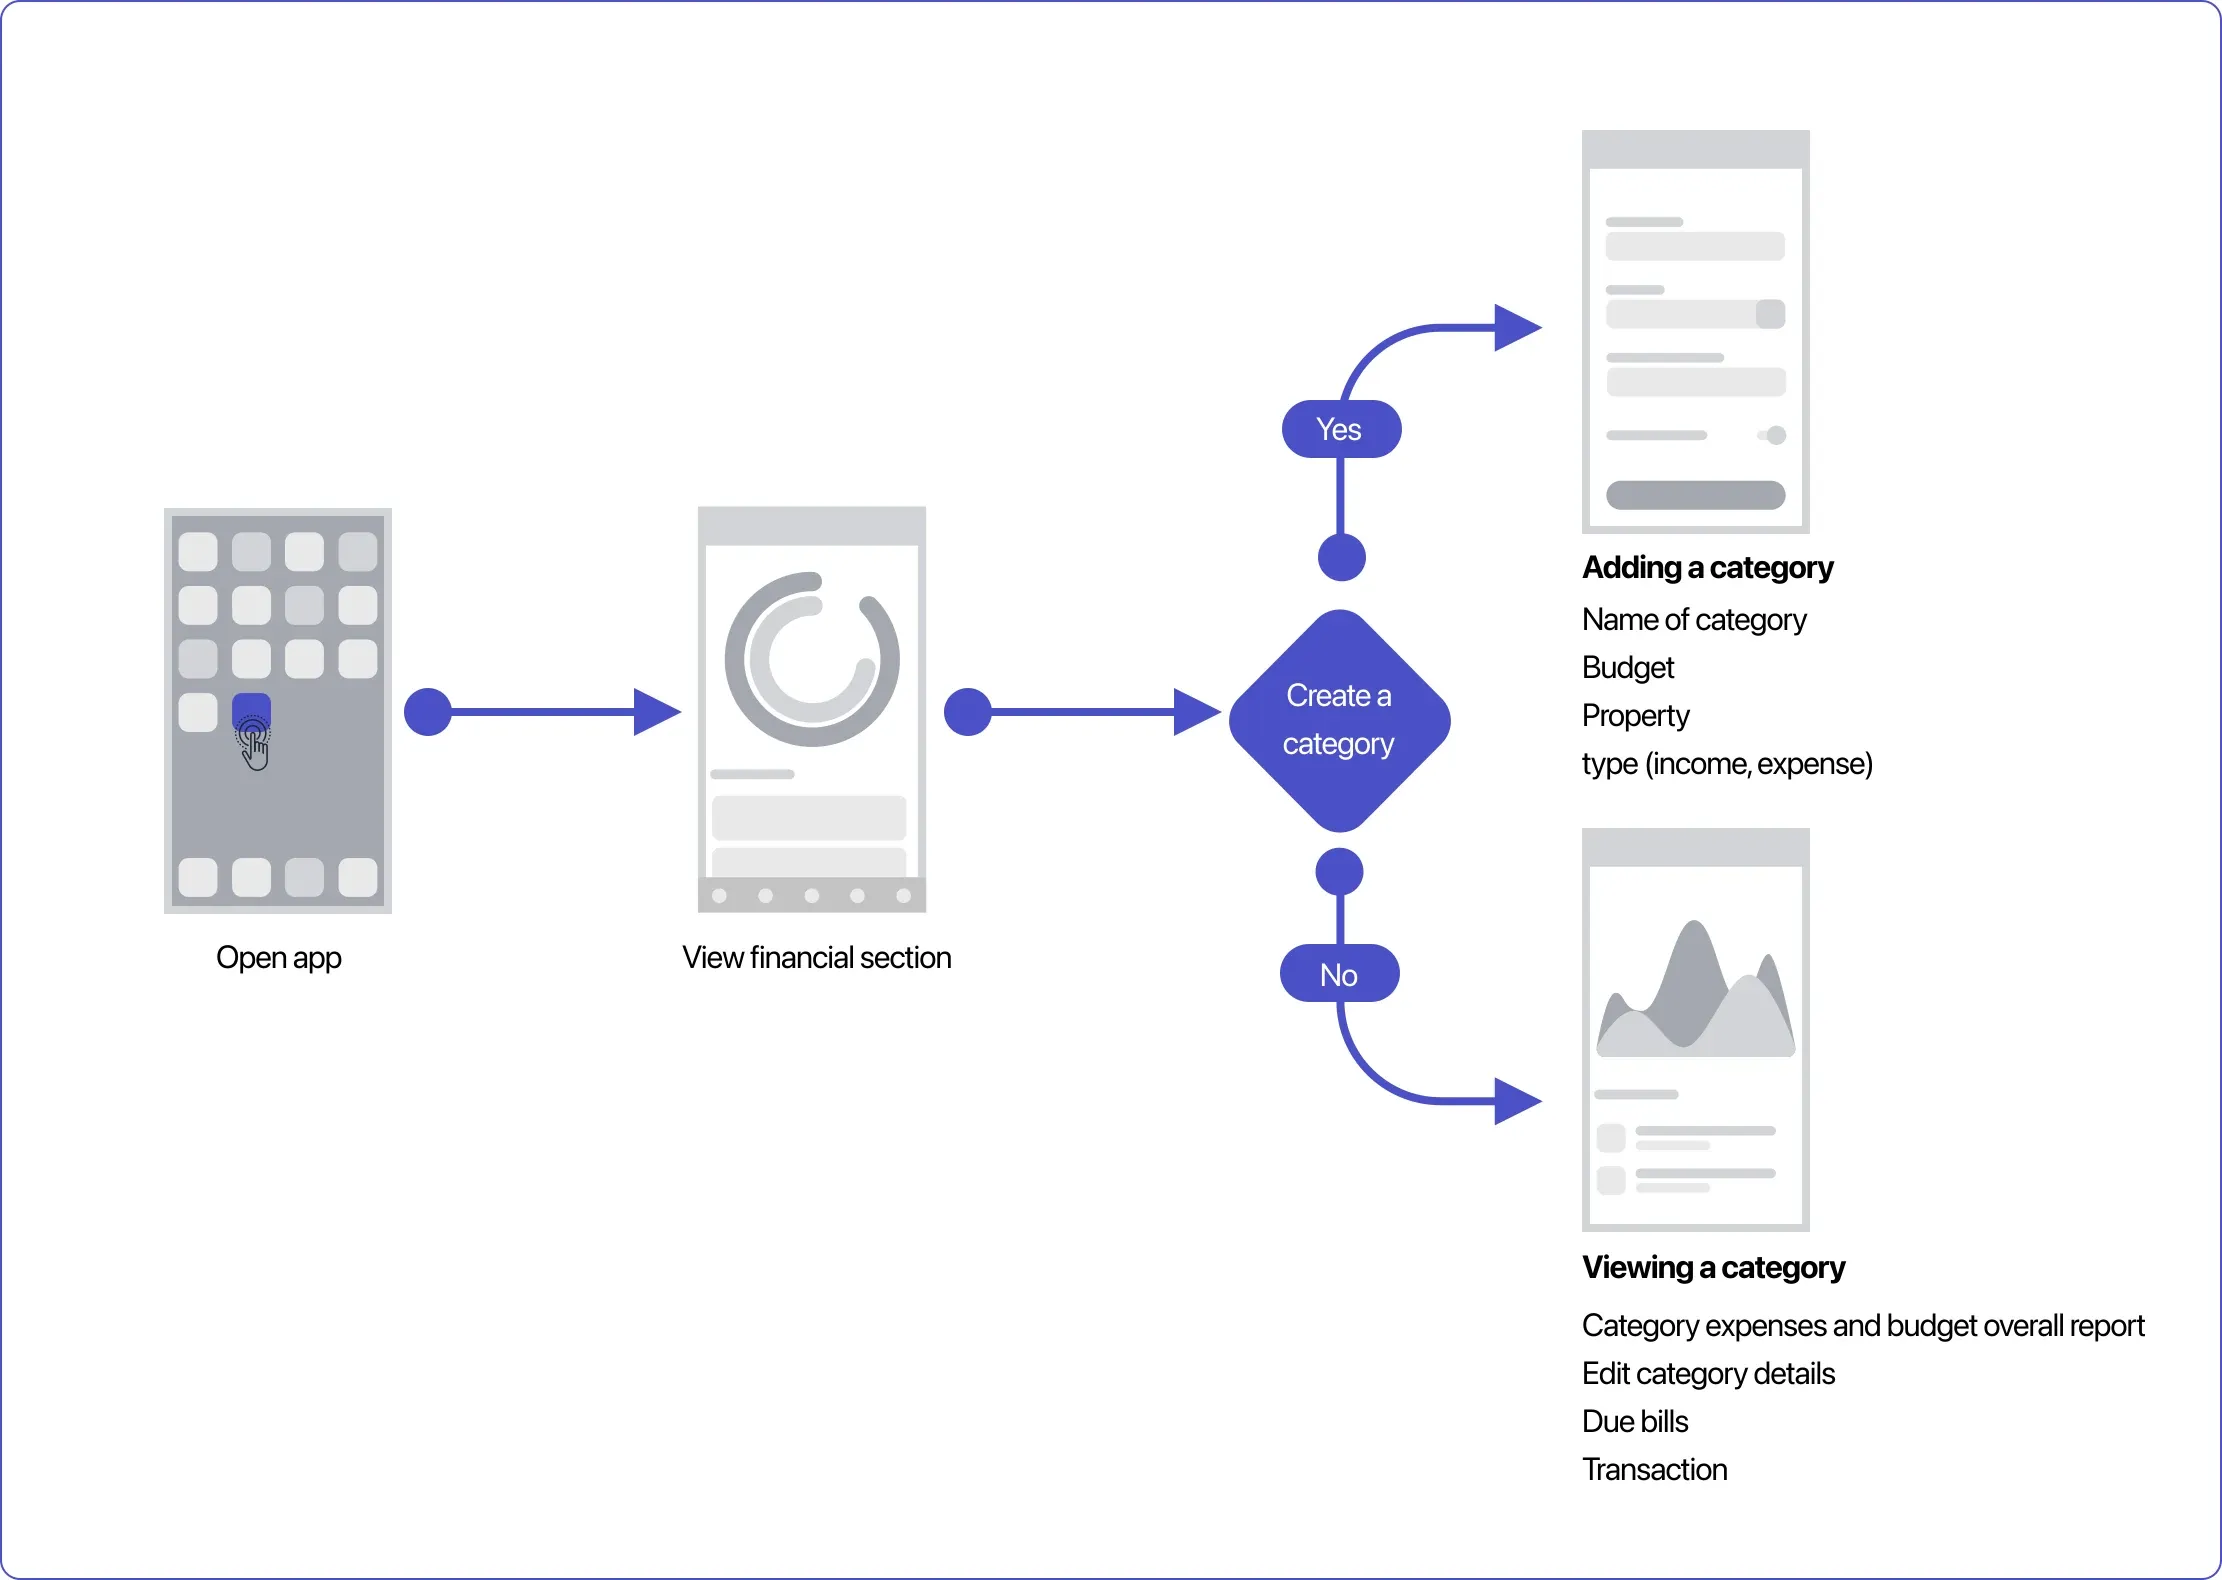
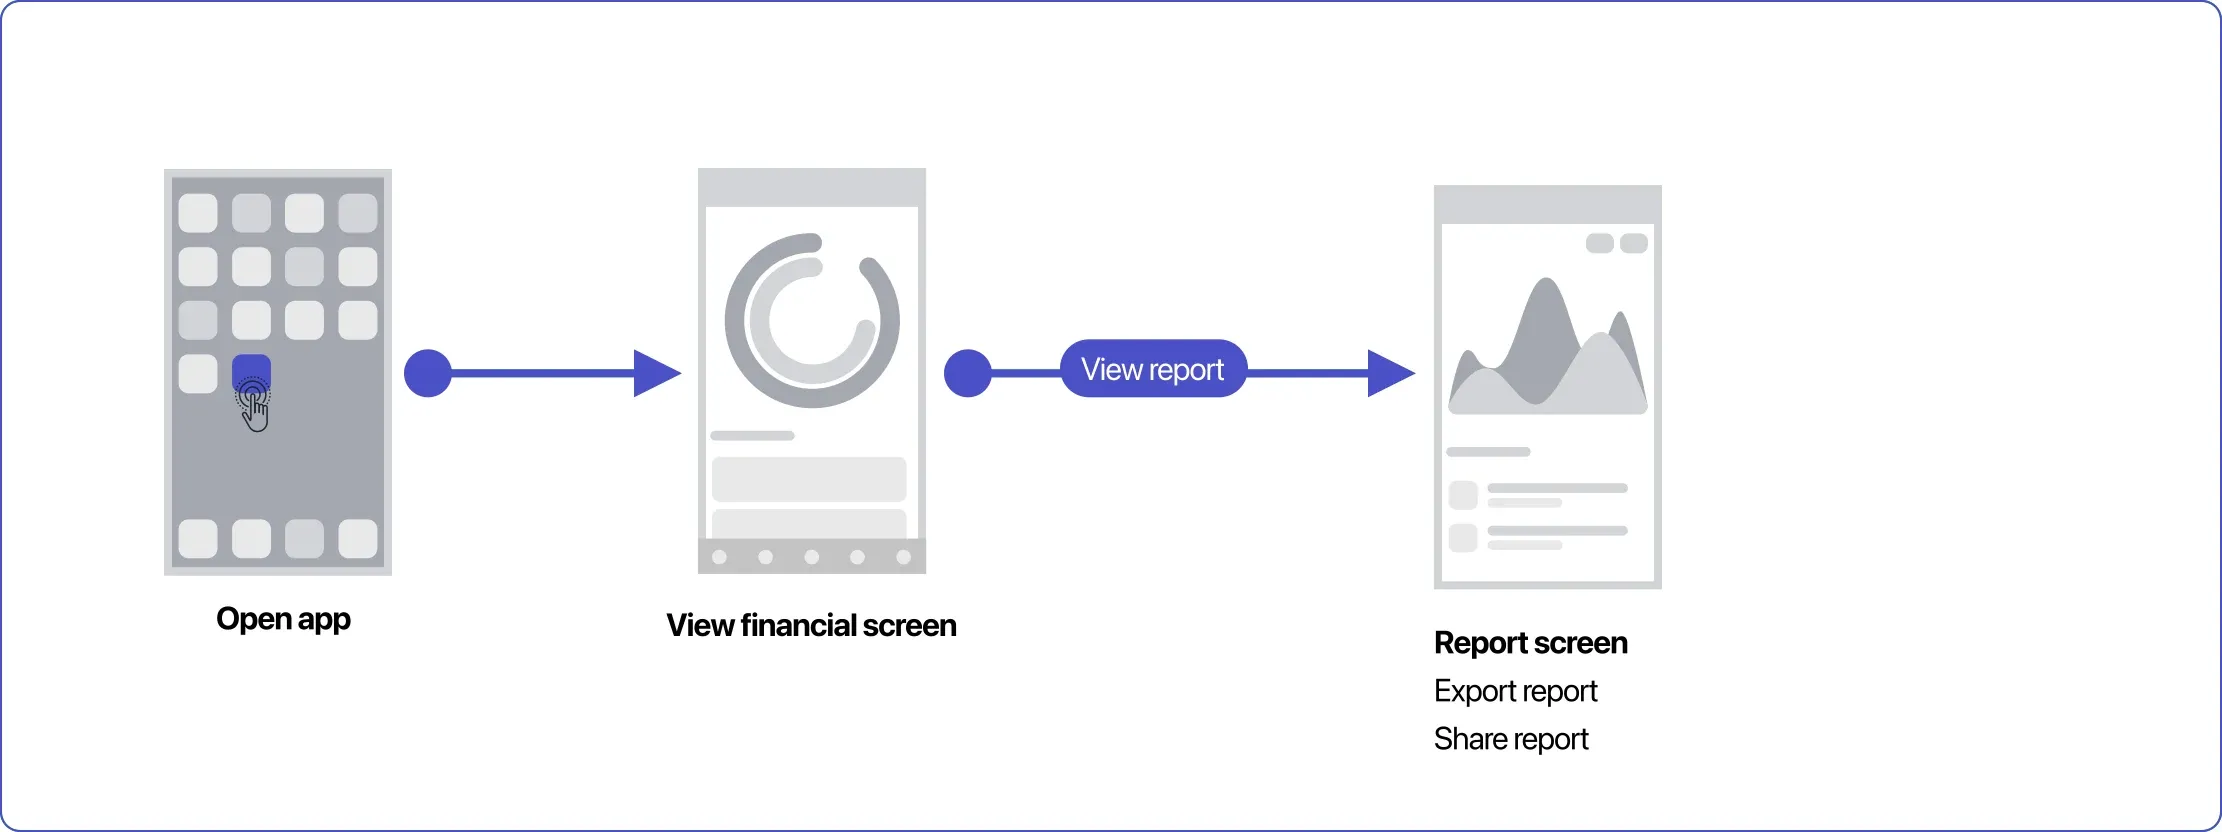
Task flows
- Task 01: Create budget categories.
- Task 02: View and export reports.
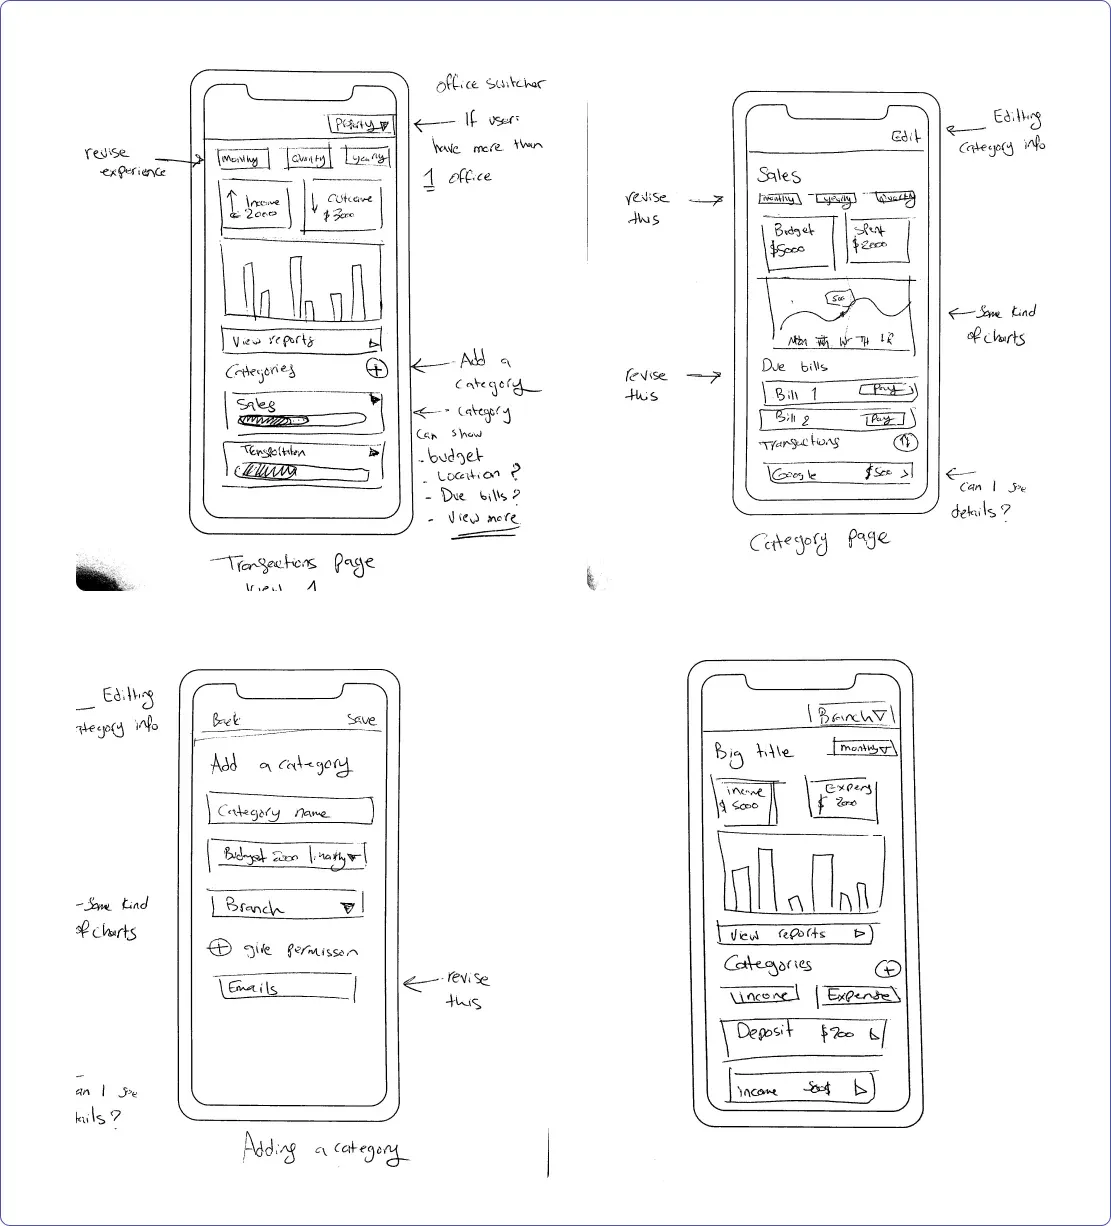
Low-fidelity wireframing
High-fidelity wireframing
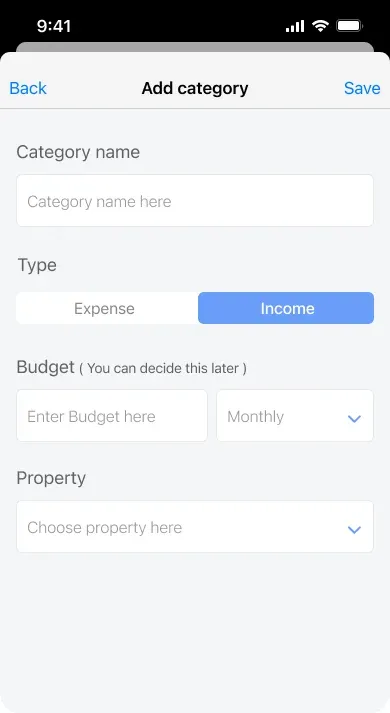
Add category
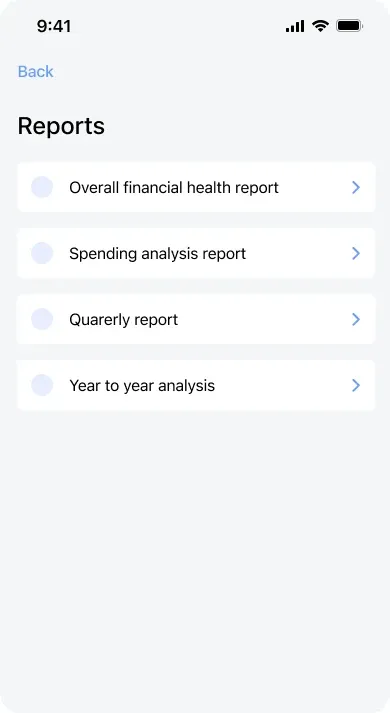
Reports
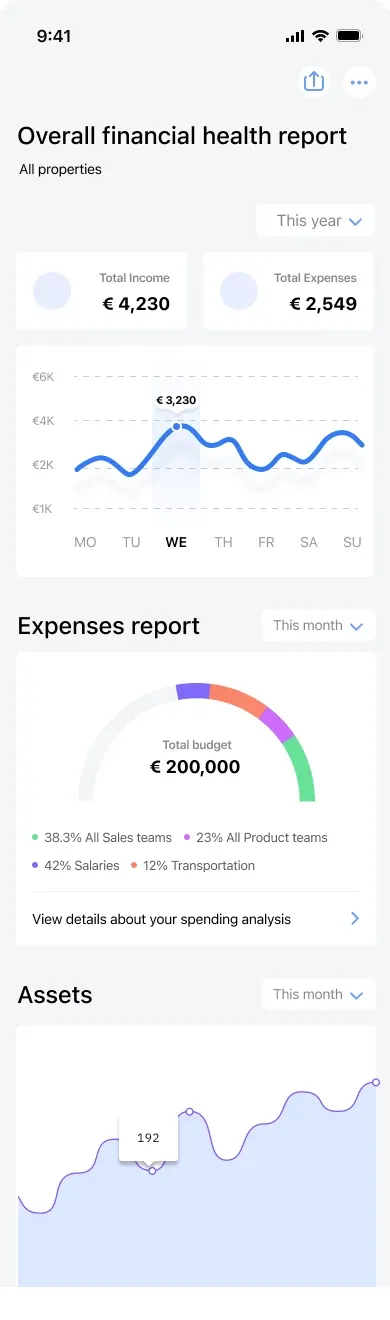
Financial health report
Prototyping & usability testing
At this phase I usually run a round of testing to verify the design. I create a prototype and a set of tasks for users to complete while I observe and record their reactions, typically with five users. I normally build the prototype in Framer, as it offers a better mobile experience for testing.
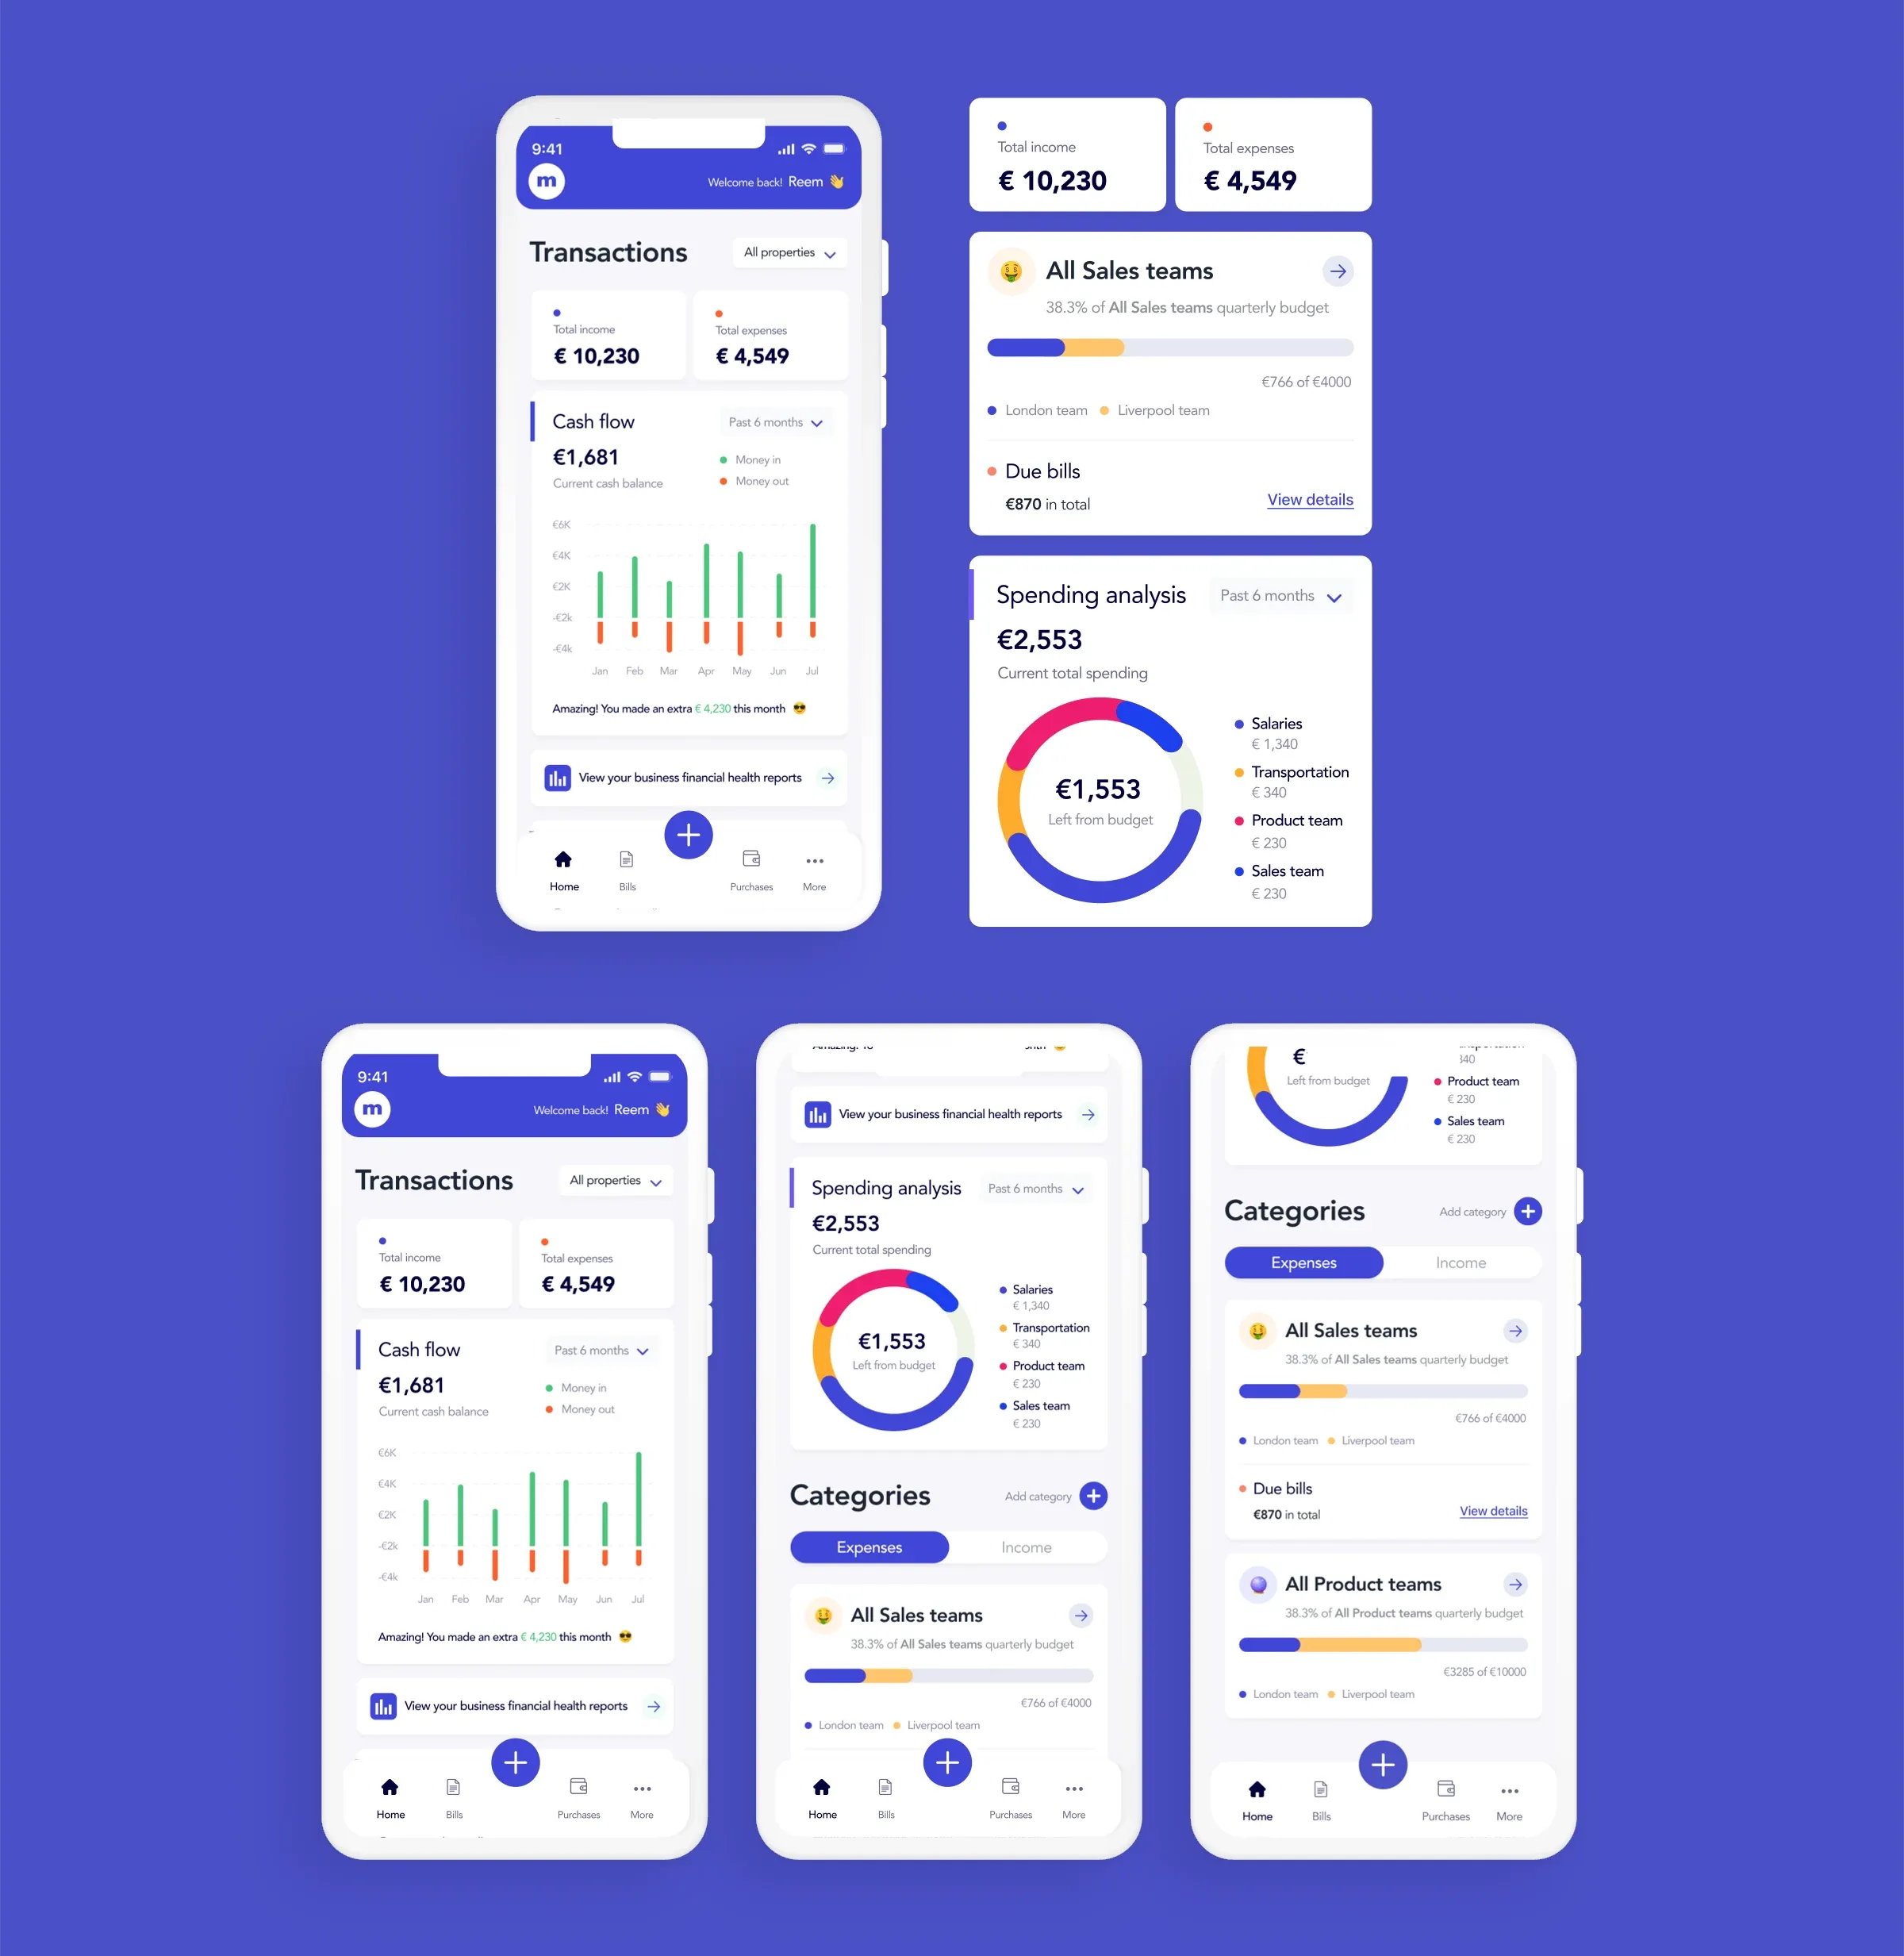
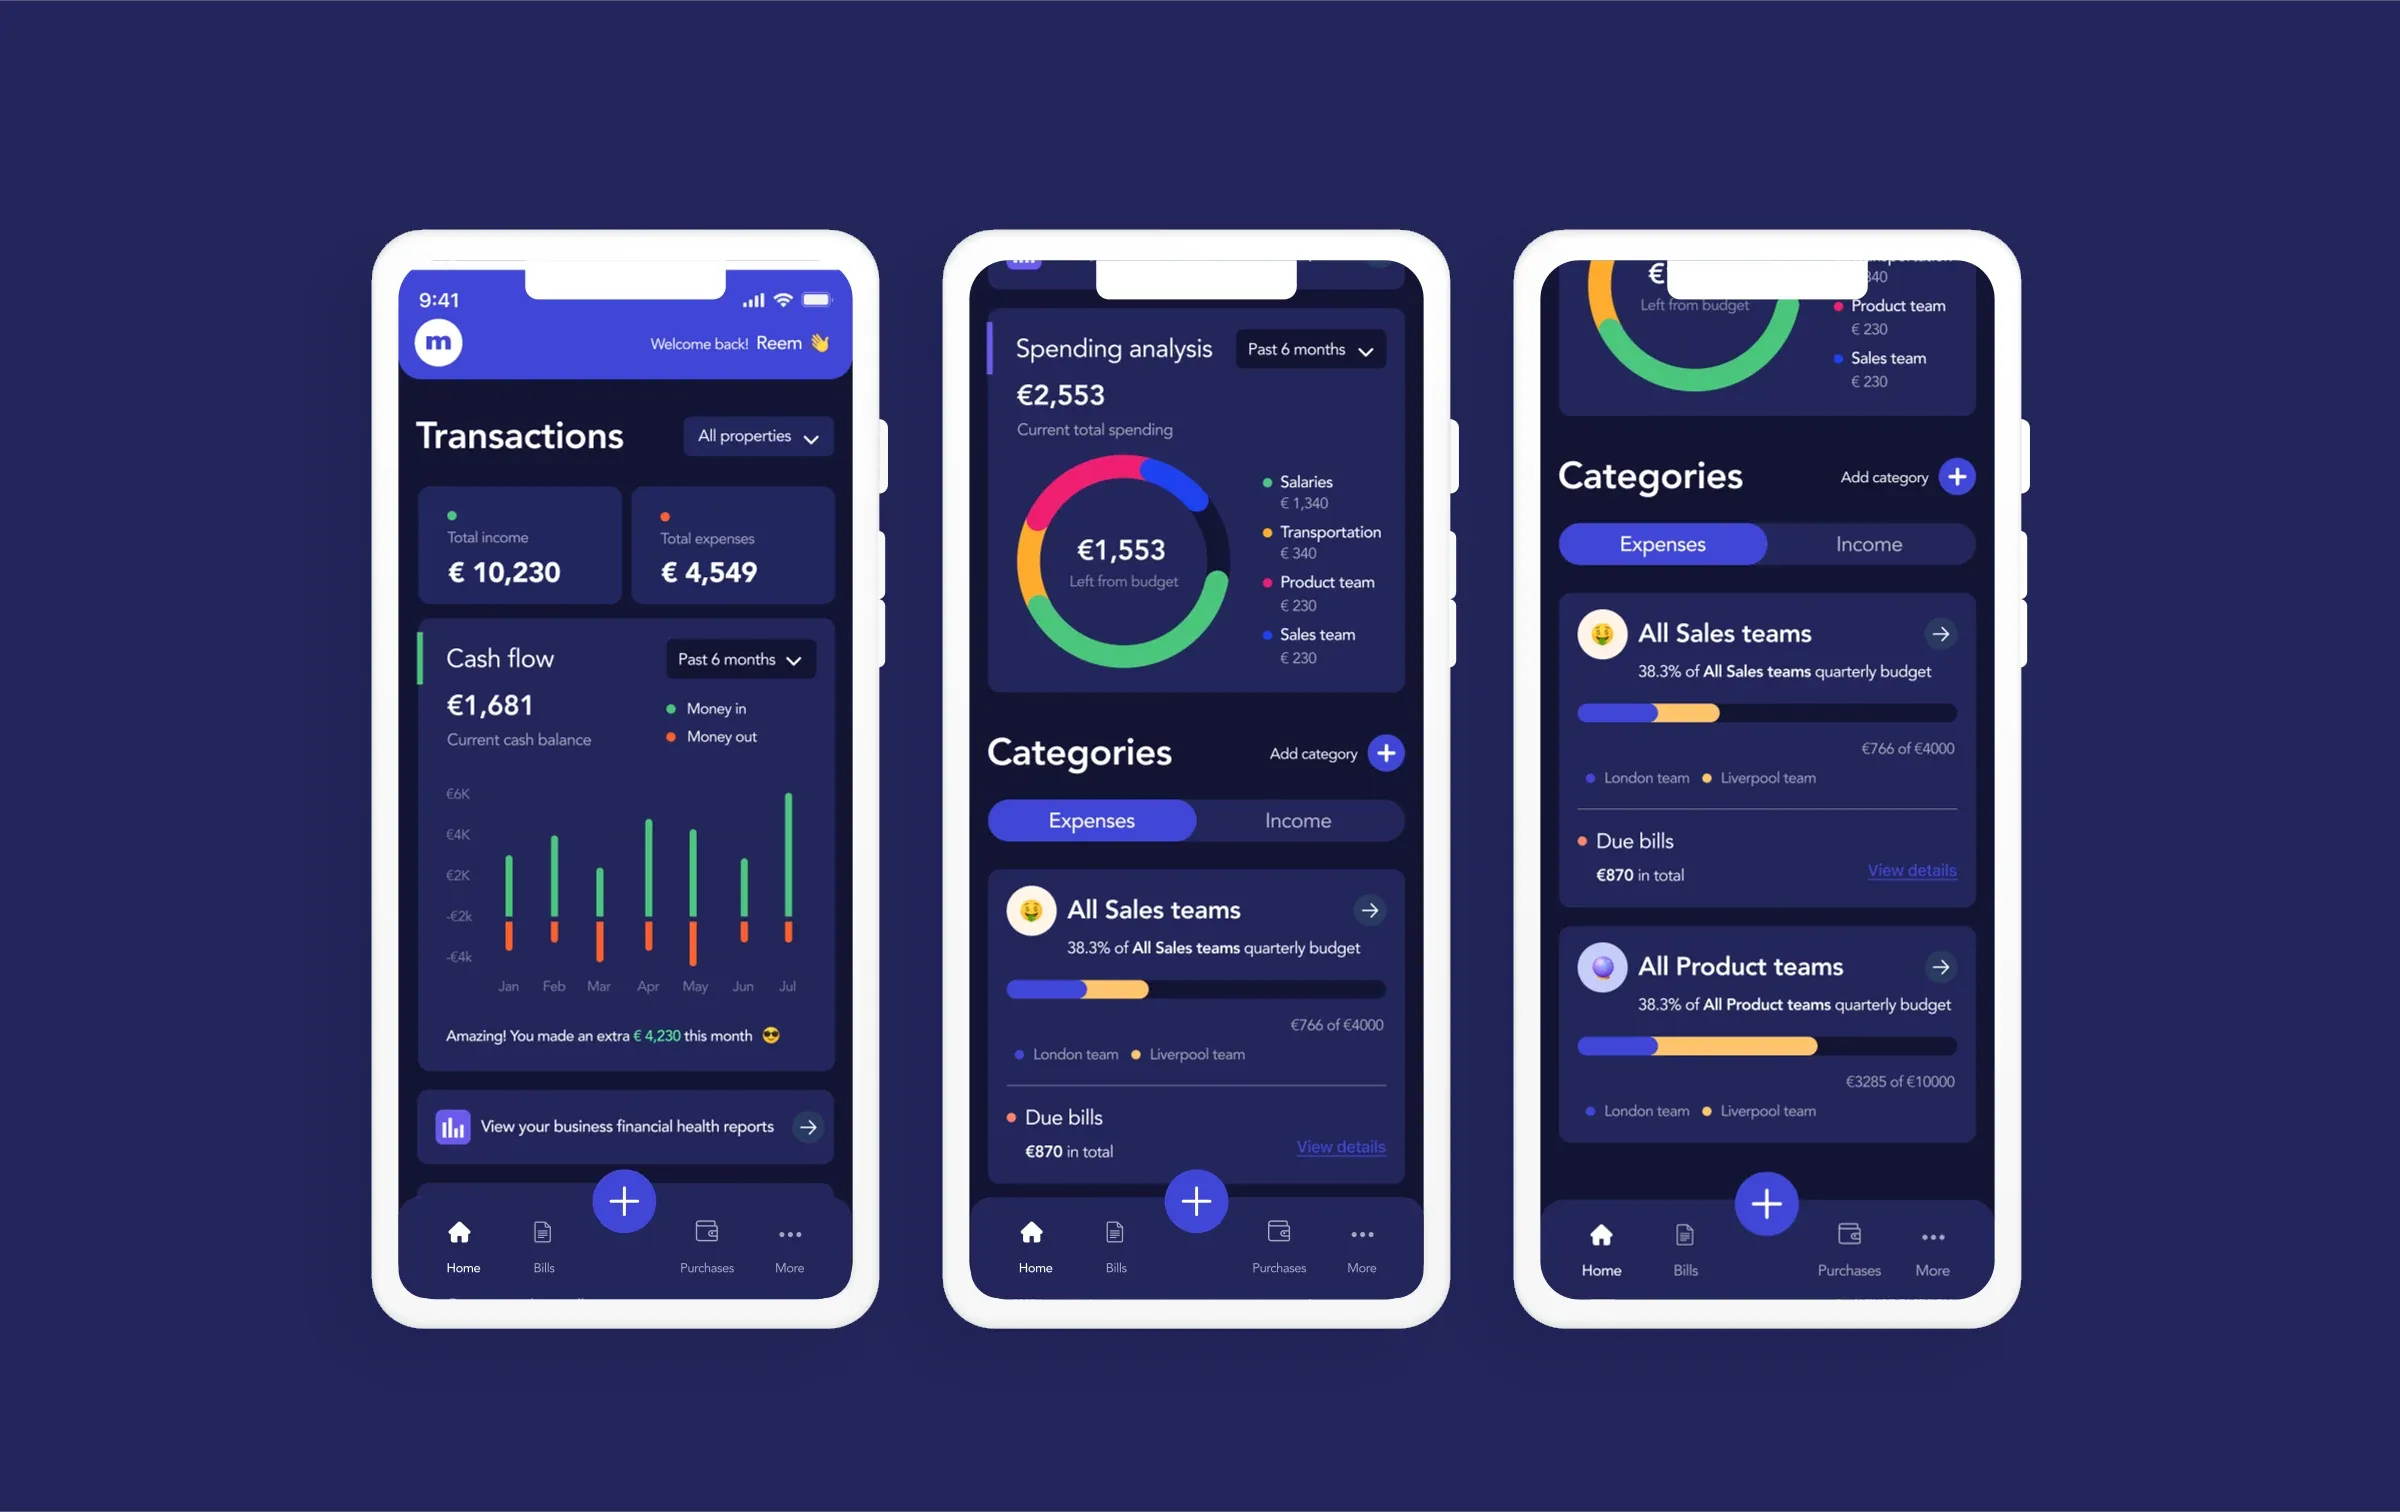
The user interface